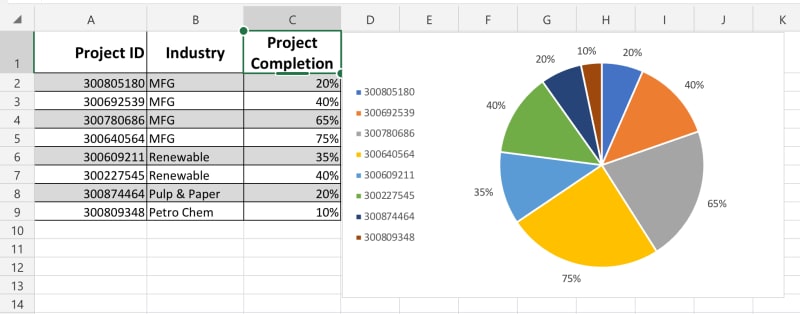
I have a table that has many rows with one of the columns which has an non-calculated percentage. I want to create a pie chart with this column as an axis. How do I do this? See attached example. thanks for your time.
Tek-Tips is the largest IT community on the Internet today!
Members share and learn making Tek-Tips Forums the best source of peer-reviewed technical information on the Internet!
-
Congratulations derfloh on being selected by the Tek-Tips community for having the most helpful posts in the forums last week. Way to Go!
I have a table that has many rows w
- Thread starter jlr123
- Start date

![[glasses]](/data/assets/smilies/glasses.gif "[glasses] [glasses]") Just traded in my OLD subtlety...
Just traded in my OLD subtlety...![[tongue]](/data/assets/smilies/tongue.gif "[tongue] [tongue]")
Similar threads
- Locked
- Question