Mary, I'm retired now, but during my career, someone, maybe my boss, would give me a report that someone else generated and ask me to do some further analysis in order to generate some other set of data.
This was ALWAYS more difficult that the effort to generate the original report. ALWAYS! That's the case we have here. Whether in Access or Excel, the solution will be cleaner working from scratch rather than putting a patch on and existing process.
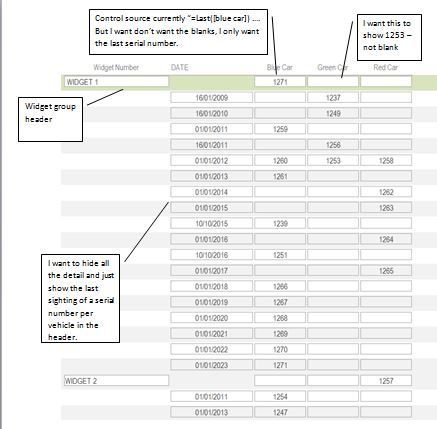
Now that I have a clearer picture of what you're shooting for, check this out. Again a Structure Table (
tSN) in Excel with a new column
KEY with formula:
=IF(ISBLANK([@SN]),"ZZZZ",[@WIDGET]&[@CAR]) and sorted by KEY asc, DTE desc as shown:
[pre]
DTE SN WIDGET CAR KEY
[highlight #FCE94F]1/7/2016 1236 1 car1 1car1[/highlight]
1/7/2014 98 1 car1 1car1
1/1/2012 87 1 car1 1car1
[highlight #FCE94F]1/1/2012 5651 1 car2 1car2[/highlight]
[highlight #FCE94F]1/5/2012 4521 1 car3 1car3[/highlight]
1/5/2011 97 1 car3 1car3
[highlight #FCE94F]1/5/2012 9999 2 car1 2car1[/highlight]
1/5/2011 95 2 car1 2car1
[highlight #FCE94F]1/1/2012 4523 2 car2 2car2[/highlight]
1/1/2011 94 2 car2 2car2
[highlight #FCE94F]1/7/2016 7852 2 car3 2car3[/highlight]
1/7/2014 96 2 car3 2car3
[highlight #FCE94F]12/7/2016[/highlight] 1 car1 ZZZZ
1/7/2016 2 car3 ZZZZ
[highlight #FCE94F]1/5/2013[/highlight] 1 car2 ZZZZ
[highlight #FCE94F]1/1/2013[/highlight] 1 car3 ZZZZ
[highlight #FCE94F]1/5/2012[/highlight] 2 car1 ZZZZ
[highlight #FCE94F]1/1/2012[/highlight] 2 car2 ZZZZ
[/pre]
Here's your report, where the static data is a unique list of WIDGETs vertically and CARs horizontally. The report table starts in cell G1:
[pre]
WIDGET car1 car2 car3
1 [highlight #729FCF]1236 5651 4521[/highlight]
2 [highlight #729FCF]9999 4523 7852[/highlight]
[/pre]
...the formula: [highlight #729FCF]
=INDEX(OFFSET(tSN[SN],MATCH($G2&H$1,tSN[KEY],0)-1,0,COUNTIF(tSN[KEY],$G2&H$1),1),1,1)[/highlight]
The key to this solution is the helper column in the source data, the formula in the source data and the sort in the source data, which places the data that you need in the first position of each WIDGET&CAR. Notice that the data from the highlighted rows appear in the report and that the highlighted dates with blank SNs are all later than the dates for the data in the report as per your requirements.
Skip,
![[glasses]](/data/assets/smilies/glasses.gif "[glasses] [glasses]") Just traded in my OLD subtlety...
Just traded in my OLD subtlety...
for a NUance!![[tongue]](/data/assets/smilies/tongue.gif "[tongue] [tongue]")
")