Tek-Tips is the largest IT community on the Internet today!

Members share and learn making Tek-Tips Forums the best source of peer-reviewed technical information on the Internet!

  • Congratulations gkittelson on being selected by the Tek-Tips community for having the most helpful posts in the forums last week. Way to Go!

Use of Coverage profiler to find my bottleneck

Status
Not open for further replies.

Koen Piller

Programmer
Jun 30, 2005
841
NL
Hi,

Reading Mike's I am using the Coverage Profiler to find the bottleneck in a little procedure to make a calendar showing DayLightSavingTime and marking National Holidays. Thing works fine but is way tooo slow, so I was about to use the CP to show me the bottlenecks.
However this did not make me any wiser: all entries on Bexectime (3226) give 0.00 and only 1 for for the init gives 2.46 (about the time it needs to start). How can I extend the logged time on Bexectime to show me the bottleneck?

Regards,

Koen
 
What are you logging and how do you start and stop logging?

Coverage logging may not cover times for events with no code in them, it only logs time used within each line of (your) code. Also, the Coverage Profiler tool may only show min/max/average time or even only coverage, meaning IF a line is executed at all. You might get a better picture of time usage if you import into a simple cursor and aggregate times yourself:

Code:
Create Cursor curCoverage (bExecTime B, cClass C(128), cMethod C(128), iLine I, cFile C(254), iStacklevel I) 
Set Point To '.' 
Append From coverage.log Type CSV

If you sum notice the lowest stack level times will already summarize the higher stack levels, so it makes sense to group by iStacklevel.
In detail, if you have a function f calling a function g the line in f calling into g will be logged with the overall time of lines executed in g, so you only see detail times in the records of code lines of g and if you sum them should get the time reported for the line in f making the call.

In other words: Lines making calls with a high bExecTime point to a bottleneck within the called code and to find it, you rather have to analyze the detail code bExecTimes. Overall you don't get the best indicator by simply sorting descending, if you summarize per cClass, cMethod, iLine and iStacklevel you get the summary of each single line and that'll also reflect number of iterations.

And overall that also explains why the overall time sum can exceed the logging time. If you group by iStacklevel only, the stacklevel 1 times should be the sum of all higher stack level times and so on. It's not simply the longest bExecTimes pointing out the code lines to look at, they mainly point out lines making calls.

Bye, Olaf.
 
Olaf,

I have set in the init of myform at the first line:
Code:
SET COVERAGE TO coverage.log
and at the last line:
Code:
SET COVERAGE TO

(I did study Mike's article)

which should cover all the coding of my init, the log file shows yours
Olaf said:
if you have a function f calling a function g the line in f calling into g will be logged with the overall time of lines executed in g,
makes no sense to me because I will summing up only 0.00 hte problem is that the functions, although executing some millisecs show 0.00 how to increase these 0.00 to sensible times?

Regards,
Koen
 
Well, end of Form init is not yet the end of the form lifetime. If you want to log what happens WHILE the form runs, put you SET COVERAGE TO in the Unload() or Destroy().
With todays hard drives you can simply start logging in main.prg and stop logging after READ EVENTS or in your shutdown code only.

Bye, Olaf.
 
Hi,

I did import into a cursor, as per Mike's advise,
Code:
Create Cursor curCoverage (bExecTime B, cClass C(128), cMethod C(128), iLine I, cFile C(254), iStacklevel I)

now changed into
Code:
CREATE CURSOR curCoverage ( nExecTime N(20, 10), cClass c(30), cObj c(60), nLine i, cFile c(60), cStack i )

which will result into sensible values in nExctime

Tamar, thanks for pointing me to the correct solution.

Regards,
Koen
 
You don't need to change to N(20,10), you just need SET POINT TO "." as per my example. Besides the thread you point to was mine, not Mikes. Mike just warned about the cursor size exceeding 2GB. I work with "wide" fields with logs covering half an hour session of testing EXEs, it's just fine.

PS you just have to write the shorthand thread184-1775724 given under any threads caption to get the nicely labeled link thread184-1775724.

Bye, Olaf.

 
Reading Mike's
...

I did import into a cursor, as per Mike's advise,

...

(I did study Mike's article)

The thread you referenced was Olaf's not mine, nor did I write an article about this. I merely added a minor comment to the thread.

Mike


__________________________________
Mike Lewis (Edinburgh, Scotland)

Visual FoxPro articles, tips and downloads
 
Olaf,
Sorry, did not notice your signature, only Mike's at the bottom. Hope no offense.
About the "set point to '.'" this was added however the bExectime gave only 0000, it was with the cursor creation by Tamar only your program worked as a charm.
Now studying the results to make this thing (my calendar.vcx) work fater.
Bye,
Koen

p.s. if you are iterested I could upload my unchanged class with readcoverage.prg for your experience to see what the results are with a field " bExecTime B " instead of a " nExecTime N(20, 10) " in the cursor.

 
I use this all the time this way and I can't think why this wouldn't work, but that your runtime writes numbers with "," as the decimal point. VFP9 in English without any locale resource DLL (DFPUG offered some localizations of the English only VFP9), would perhaps make coverage logging write out execution times with ",". I don't see other settings influencing the numeric conversions. Also, if coverage logging itself would write out times with comma as decimal points, that would separate the decimals into a separate field/column as the overall lines are CSV, comma separated values.

I know the effect all numbers come in as 0, but only when I keep SET POINT to the German locale ",", as the coverage log has the numbers with the decimal point.

And I don't see another setting influence the conversion to float.

Bye, Olaf.
 
Olaf,

My coverage log looks like:

Code:
   0.003938,calendar,calendar.init,11,d:\foxexamples\calendar\kalender map\calendar.vct,2

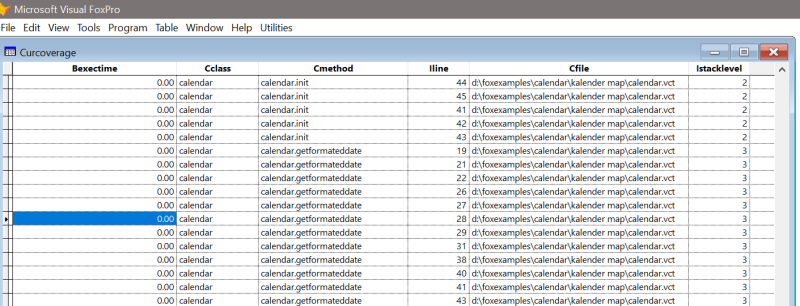
my cursor (brows) looks like:
screenshot_baadot.png


Only when I change the first field declaration from B to N(10,6) it shows the decimals.
Point is setted to "." (dot)
not using german DLL, default English with local settings like point = "." and separator = ","

Regards,
Koen
 
Olaf,
that did it, after I added:
Code:
lnDecimals = SET("Decimals")
SET DECIMALS TO 10

it works as expected. Thanks a lot!

Regards,

Koen
 
OK, fine, just notice it's not necessary to do before APPEND, the conversion is independent on SET DECIMALS, but the display is by default only with 2 decimals.

You can also see that from BROWSE FOR bExecTime>0 or SELECT SUM(bExecTime) FROM curCoverage giving you a total>0

In a grid you would use FORMAT="R" and an inputmask with the desired precision.

Bye, Olaf.
 
Olaf,

you are 100% correct, not ness. but for me a default practise: when ever I change a setting I keep the old setting, change and after work done change back to the oldsetting.
This way I can never ever come into an unwanted setting.
Maybe not ness, but very handy.

Regards,

Koen
 
Status
Not open for further replies.

Part and Inventory Search

Sponsor

Back
Top