ScottKennie
IS-IT--Management
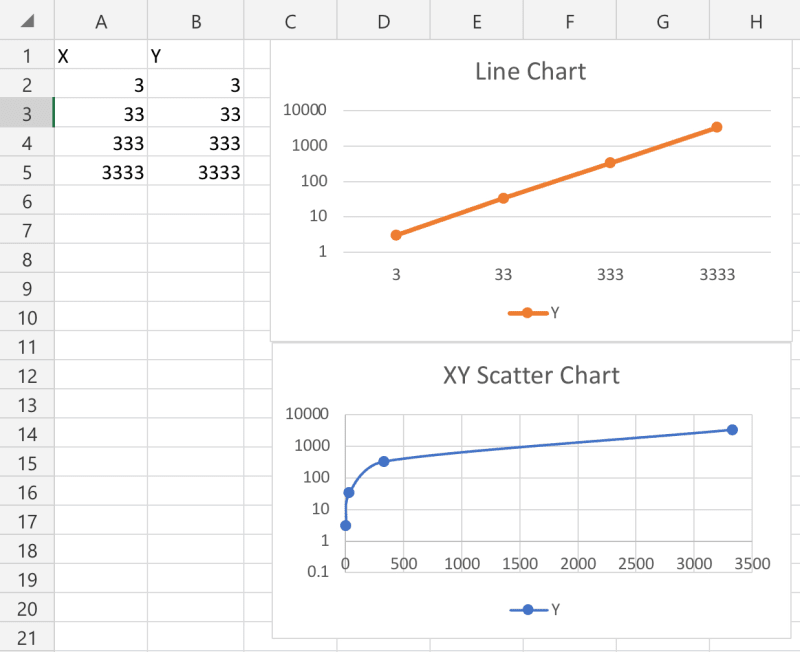
We currently have a line chart in EXCEL that I want
 to convert to SSRS.
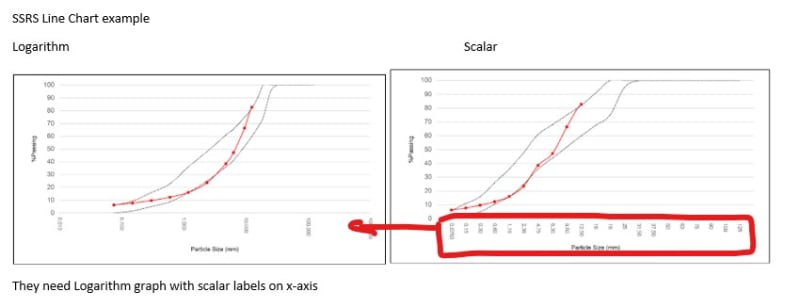
In EXCEL the line chart is logarithmic with scalar labels on the x-axis.
I cannot seem to find a way to change the labels in the x-axis for a logarithmic line chart in SSRS. I can either have Logarithmic or Scalar - that's it! (See Attachment)
Any help would be appreciated.
In EXCEL the line chart is logarithmic with scalar labels on the x-axis.
I cannot seem to find a way to change the labels in the x-axis for a logarithmic line chart in SSRS. I can either have Logarithmic or Scalar - that's it! (See Attachment)
Any help would be appreciated.
![[glasses]](/data/assets/smilies/glasses.gif "[glasses] [glasses]") Just traded in my OLD subtlety...
Just traded in my OLD subtlety...![[tongue]](/data/assets/smilies/tongue.gif "[tongue] [tongue]")