Tek-Tips is the largest IT community on the Internet today!

Members share and learn making Tek-Tips Forums the best source of peer-reviewed technical information on the Internet!

  • Congratulations Mike Lewis on being selected by the Tek-Tips community for having the most helpful posts in the forums last week. Way to Go!

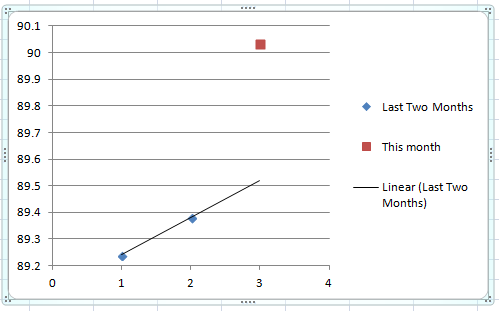
SLOPE FUNCTION in vba from formula, wath is wrong????

Status
Not open for further replies.

2009luca

Programmer
Jul 27, 2013
222
0
16
IT
Sub Macro6()

Dim SL As Double
Dim X4, Y4, K4
Dim SLopeARRAY As Variant

x4 = 45
Y4 = 38
K4 = 14

SLopeARRAY = Array(X4, Y4, K4)

SL = Application.WorksheetFunction.Slope(SLopeARRAY;{1;2;3})

End Sub
 
What hints is VBA giving you?
(For starters your first semicolon should probably be a comma, since the SLOPE function requires two arguments.)
 
luca, you are not using the SLOPE() function correctly. Please check Excel HELP! Excel wants to evaluate 2 arrays.

This is not
[tt]
ax[sup]2[/sup] + bx + c
[/tt]
which is the closest I could come to guessing at what you may be thinking, with 3 point values. Just a guess.
 
PLAYED with vba....wath about?

Code:
Option Explicit
Sub SL_OPE()

    Dim SL As Double
    Dim Xs() As Variant, Ys() As Variant
    Dim X4, Y4, K4

    X4 = 89.24
    Y4 = 89.38
    K4 = 90.03

    'NUMERO DI ARGOMENTI UGUALI PER Xs e Ys
    
    Xs = Array(X4, Y4, K4)
    Ys = Array(1, 2, 3)

    SL = Application.WorksheetFunction.Slope(Xs, Ys)
    
    'OPPURE PIU VELOCE SE IN LOOP CELLE
    'With Application.WorksheetFunction
    '    SL = .Slope(Ys, Xs)
    'End With

End Sub
 
Well, what about it?

What result did you get and was it what you expected?

You might also be interested in the INTERCEPT() function.
 
I Skip,

in effect X4, Y4, K4 are a value of "dossier" processed in my farm, the data of month genuary(X4), febrary(Y4) and march(K4).

I need to calculate based the last month (March) wat is the tendence in SL

i my case, i think, the value of SL is improving.

Is the Slope function the best method to culculate the improving or worsening based the last value in month ?

note:
All 3 value in array are alway in sequence, genn febb march, or for example sept oct, nov....ecc
 
You can see this best if you plot the data and add a linear trend line. There are other trend alternatives as you will see if you plot & trend.
 

You could use linear extrapolation...
[tt]
y(x) = y1 + [x – x(1)]/[x(2) – x(1)]*[y(2) – y(1)]
[/tt]
 
sorry Skip... but i dont understand
can you post an example with my data in first post.

x4 = 45
Y4 = 38
K4 = 14

Tks.
 
I am reluctant to use your example, because it seems to have, at its core, a misconception.

Here is the data I am using in my example on my sheet, actually from your revised code posting...
[pre]
x y

1 89.24
2 89.38
3 90.03
4 [highlight #FCE94F]=B3+(A5-A3)/(A4-A3)*(B4-B3)[/highlight]
[/pre]

So on a plot, its like drawing a straight line between the last two plot points and extending it one unit on the x-axis.

 
Please try to describe what you want to do. Not how you think it should be done. This will result in much better advice.

Why are you trying to use VBA for this? Just work in a spreadsheet. Then you can easily use the functions, charts etc.

Capture_xre7s2.png


Probably you want TREND(). But a projection made from two data points is pretty worthless.
 
Status
Not open for further replies.

Part and Inventory Search

Sponsor

Back
Top