Olaf Doschke
Programmer
I have an application in maintenance, which starts slow and about 50% of the initialization time doesn't show up in a coverage.log I did via [tt]SET COVERAGE TO some.log[/tt]
The log record for DO form reflects the real world time I can also stab, about 4 seconds.
The coverage log of all stack levels of code from the DO FORM line up to getting back after DO form sums up to only two seconds (roughly).
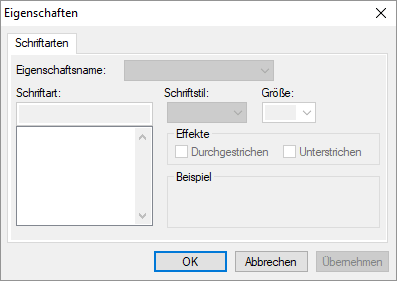
Was mentionable is a calendar control (dayview.ocx) used (the vendor of that doesn't exist anymore) which has the Font object typical for VB (classic), so you have ocx.object.Font.Size and so on. I can't set these properties. Side question: Does anyone know how to cope with this. Even in ActiveX control design-time properties I only get this dialog - disabled and greyed out:

The German Vocabulary - though not that importatn, it's clearly a font selection dialog:
Eigenschaften = Properties
Schrfitarten = Fonts
Eigenschaftsname = Property Name
Schrfitart = Font
SchriftStil = font Style
Größe = Size
Effekt = Effects
Durchgestrichen=Strike-Through
Unterstruchen=Underline
Beispiel = Example
Abbrechen = Cancel
Getting back to the coverage logging missing time: I know views in the data environment of a form will take time and not log into the coverage log, the only other thing I can think of is properties set to =expression and base class behavior.
Any other ideas for what to look?
What else is not logged into coverage.log?
By the way, it doesn't matter if I log at design time with source code or in the EXE and the EXE is compile with debug info, so I do get the same amount of log lines in both cases.
Bye, Olaf.
Olaf Doschke Software Engineering
The log record for DO form reflects the real world time I can also stab, about 4 seconds.
The coverage log of all stack levels of code from the DO FORM line up to getting back after DO form sums up to only two seconds (roughly).
Was mentionable is a calendar control (dayview.ocx) used (the vendor of that doesn't exist anymore) which has the Font object typical for VB (classic), so you have ocx.object.Font.Size and so on. I can't set these properties. Side question: Does anyone know how to cope with this. Even in ActiveX control design-time properties I only get this dialog - disabled and greyed out:

The German Vocabulary - though not that importatn, it's clearly a font selection dialog:
Eigenschaften = Properties
Schrfitarten = Fonts
Eigenschaftsname = Property Name
Schrfitart = Font
SchriftStil = font Style
Größe = Size
Effekt = Effects
Durchgestrichen=Strike-Through
Unterstruchen=Underline
Beispiel = Example
Abbrechen = Cancel
Getting back to the coverage logging missing time: I know views in the data environment of a form will take time and not log into the coverage log, the only other thing I can think of is properties set to =expression and base class behavior.
Any other ideas for what to look?
What else is not logged into coverage.log?
By the way, it doesn't matter if I log at design time with source code or in the EXE and the EXE is compile with debug info, so I do get the same amount of log lines in both cases.
Bye, Olaf.
Olaf Doschke Software Engineering
