Tek-Tips is the largest IT community on the Internet today!

Members share and learn making Tek-Tips Forums the best source of peer-reviewed technical information on the Internet!

  • Congratulations SkipVought on being selected by the Tek-Tips community for having the most helpful posts in the forums last week. Way to Go!

Power Pivot Filter out Rows where data is not in all columns

GPnew

Programmer
Nov 12, 2001
56
0
6
NZ
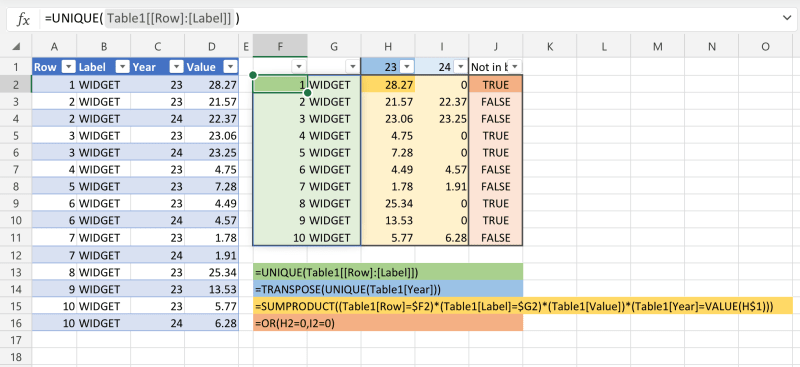
I have created a power pivot table to show the % year on year (23 to 24) change, of the weighted average prices per part
Not all parts had sales in both 23 and 24 = TRUE in the last column

I would like to filter out the TRUE's or even create a slicer on that column

When I dragged the column "NotinBothYears" to the filter box in but got the error message
"The field you are moving cannot be placed in that area of the report"
Apart from the Part column ,all columns are measures


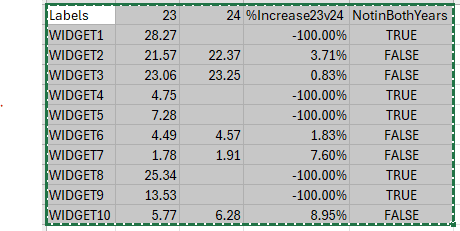
The pivot table looks like this
Row Labels 23 24 %Increase23v24 NotinBothYears
1WIDGET 28.27 -100.00% TRUE
2WIDGET 21.57 22.37 3.71% FALSE
3WIDGET 23.06 23.25 0.83% FALSE
4WIDGET 4.75 -100.00% TRUE
5WIDGET 7.28 -100.00% TRUE
6WIDGET 4.49 4.57 1.83% FALSE
7WIDGET 1.78 1.91 7.60% FALSE
8WIDGET 25.34 -100.00% TRUE
9WIDGET 13.53 -100.00% TRUE
10WIDGET 5.77 6.28 8.95% FALSE


I would assume your data looks more like this:

[pre]
Row Labels 23 24 %Increase23v24 NotinBothYears
1 WIDGET 28.27 -100.00% TRUE
2 WIDGET 21.57 22.37 3.71% FALSE
3 WIDGET 23.06 23.25 0.83% FALSE
4 WIDGET 4.75 -100.00% TRUE
5 WIDGET 7.28 -100.00% TRUE
6 WIDGET 4.49 4.57 1.83% FALSE
7 WIDGET 1.78 1.91 7.60% FALSE
8 WIDGET 25.34 -100.00% TRUE
9 WIDGET 13.53 -100.00% TRUE
10 WIDGET 5.77 6.28 8.95% FALSE
[/pre]

---- Andy

"Hmm...they have the internet on computers now"--Homer Simpson
 
Yes Thanks That is how it looks
 
'Classic' calculated fields in PT can be only in 'values' area. It may be the same case when PT uses data model. Values still can be filtered here, select any field in the column and use PT global filter button to filter values.
BTW, the calculated rates seem to use values that are not displayed in the above table, if it is not intentional, verify underlying measures.

combo
 
Thanks for your comments

What do you mean by "use PT global filter button to filter values"
 
In my case default pivot table layout has one filter button. The list to filter (for row fields) depend on the field with data in active cell.

combo
 
Are you referring to a classic pivot table or a power pivot table ...which is where I have my problem?

 
The PT layout depend on its format, not the data source. The difference is, if pivot table is based on data model, multiple tables, measures and relations defined in the model are available in single pivot table.
Measures or calculated fields have to be in 'values' area in PT (MS info concerning calculated fields here), it is the initial problem in this thread. They can't be moved to other areas.
If you like to try to find here a way to filter the table, please post a worksheet with a small set of dummy data, keeping the data model untouched.

combo
 
For quick 'n' dirty, a PT is great.

When you have requirements like yours, I've almost always gone to several other techniques:

1) Using Microsoft Query to generate a table, a non-normalized table suitable for reporting or

2) Using the UNIQUE() function (in this case to get the Row and Labels columns) and then the SUMPRODUCT() function to calculate values based on data in

My results:
tt-pt_filtering_fdjcss.png


What your source data looks like is unknown. I assumed, that your source data has a column for Row, a column for Label, a column for either Date or Year and a column for a Value.

The UNIQUE() function returns those unique values for Row and Labels and the Year values that also must use TRANSPOSE().

SUMPRODUCT() sums the values that meet the row/column-values criteria.

To select only FALSE rows is a simple filter.

Skip,
[sub]
[glasses]Just traded in my OLD subtlety...
for a NUance![tongue][/sub]
"The most incomprehensible thing about the universe is that it is comprehensible" A. Einstein

You Matter...
unless you multiply yourself by the speed of light squared, then...
You Energy!
 
 https://files.engineering.com/getfile.aspx?folder=a475df09-6020-44d5-9bd8-2b54fd11c68b&file=tt-pt_filtering.xlsx
Thanks Skip
I don't think I have explained things very well.
I am not sure how to easily create the table to apply the formulas to.

I have actually got 3 tables in my power pivot data model
1. Label (Unique across 23 and 24 Years) FYI the "label" column is actually a column of part numbers
2. 23 Sales data Label , quantity and price by invoice
3. 24 Sales data Label, quantity and price by invoice

The power pivot I have shown above , except for the row a and labels columns, are all measures created from the 3 tables in the data model

Ie weighted average sale price for 23,
weighted average sale price in 24,
% move btwn the 2 years, and
the column to determine if there are sales in each year

I am new to POWER Pivots am quite confused!!

Also apologies. It should not be the same part. Each row on the table is unique

Labels 23 24 %Increase23v24 NotinBothYears
WIDGET1 28.27 -100.00% TRUE
WIDGET2 21.57 22.37 3.71% FALSE
WIDGET3 23.06 23.25 0.83% FALSE
WIDGET4 4.75 -100.00% TRUE
WIDGET5 7.28 -100.00% TRUE
WIDGET6 4.49 4.57 1.83% FALSE
WIDGET7 1.78 1.91 7.60% FALSE
WIDGET8 25.34 -100.00% TRUE
WIDGET9 13.53 -100.00% TRUE
WIDGET10 5.77 6.28 8.95% FALSE

I will try and post this in a better format later. How do you upload images ?
 
To format the data in your posts, you may use [highlight #FCE94F][ignore][PRE][/ignore][/highlight] tags:

[ignore][PRE][/ignore][pre]
Labels 23 24 %Increase23v24 NotinBothYears
WIDGET1 28.27 -100.00% TRUE
WIDGET2 21.57 22.37 3.71% FALSE
WIDGET3 23.06 23.25 0.83% FALSE
WIDGET4 4.75 -100.00% TRUE
WIDGET5 7.28 -100.00% TRUE
WIDGET6 4.49 4.57 1.83% FALSE
WIDGET7 1.78 1.91 7.60% FALSE
WIDGET8 25.34 -100.00% TRUE
WIDGET9 13.53 -100.00% TRUE
WIDGET10 5.77 6.28 8.95% FALSE [/pre][ignore][/PRE][/ignore]

Or, highlight your data and click:
pre_q6atdt.png


Use Preview before submitting your post

---- Andy

"Hmm...they have the internet on computers now"--Homer Simpson
 
This is your best description of your source data.
"I have actually got 3 tables in my power pivot data model
1. Label (Unique across 23 and 24 Years) FYI the "label" column is actually a column of part numbers
2. 23 Sales data Label , quantity and price by invoice
3. 24 Sales data Label, quantity and price by invoice."

But why 3 tables? Why not 1? Just keep adding to it year after year!

Label
Invoice ID
Invoice Date
Invoice Qty
Invoice Price

From a table like that you could generate all kinds of reports comparing any year's data against any other year using a join query. Seems like you're the purchasing manager comparing costs year to year.

Using ONE table like this, joining Where Label for both years AND Year([Invoice Date]) is either 2023 or 2024 will get you what you originally asked for.

Skip,
[sub]
[glasses]Just traded in my OLD subtlety...
for a NUance![tongue][/sub]
"The most incomprehensible thing about the universe is that it is comprehensible" A. Einstein

You Matter...
unless you multiply yourself by the speed of light squared, then...
You Energy!
 
Thanks Skip


I am trying to make use of the power pivot /(datamodel) functionality and it allowed me to calculate the weighted average of sales price by part by year by using a measure , (and the other 2 measures as described)

It means, each year going forward, I can just dump in the sales table for the year (or month, quarter if I want to look at movements over smaller intervals ) and push the button and get the result.

I am nearly there, except for the last step which setting up filter on the POWER PIVOT table (as described) which lead me to raise this thread.

Currently, I copy the data into a new table and filter out the trues in the last column to get the report I want.

(FYI I am comparing sales price per part year on year)

Greg

 
combo said:
...please post a worksheet with a small set of dummy data, keeping the data model untouched...
It is hard to guess the data model filters and calculations behind your power pivot table. If the input tables are Excel ones, you can attach sample workbook for analysis - leave few rows in each table with false data, but still exposing the problem you have in pivot table. Remove some private data before in the sample workbook (but not all - pivot table should work).

combo
 

Part and Inventory Search

Sponsor

Back
Top