AndrewMozley
Programmer
I make lots of mistakes in my programs and use the debugger quite a lot.
Usually I include SET STEP in the code where I want to examine what is happening, and then either step through the code or set breakpoints using the F9 key.
In this case the breakpoints are identified with a red blob in the debugger window. When they are no longer required I can then remove them either by clicking F9 again on the relevant line or by clicking Tools | Debug in my main window (where my application is running) and Remove. In either case the red blob is removed and the line is no longer listed in the Breakpoints window.
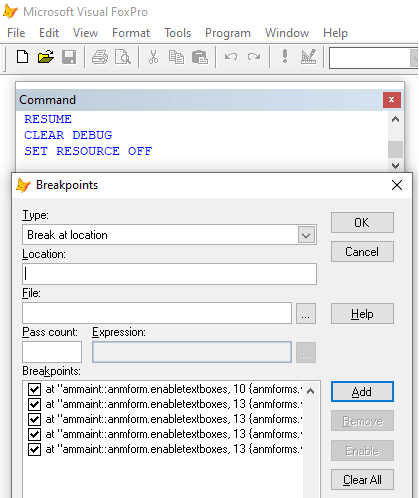
Recently however I was debugging a form class on which part of the application is running. On encountering SET STEP the debug window came up; but after navigating to a point (inside a loop examining controls) and pressing F9, the red blob did not show. The breakpoint did appear in the list in the breakpoint window. When I tried to remove the breakpoint, this did not remove it from the list in the breakpoint window, but (I believe) created a duplicate entry in that list - I now have 4 identical entries!
In the breakpoint window I can click on ‘Clear All’. That does appear to remove them from the window, but if I close and then re-open the breakpoint window, there they are again, mocking me!
I have tried various things, like reverting to a previous foxuser.dbf and opening a different (.pjx) project, but no luck. Would be most grateful if anyone can help me resolve this.
Thanks. Andrew