LookingToLearn
Programmer
We have the Enterprise version 12.0.2000 running on:
Windows 2012 R2 Standard 64 Bit
8x16GB Micron 16GB DDR4 2Rx4 (128 GB of RAM)
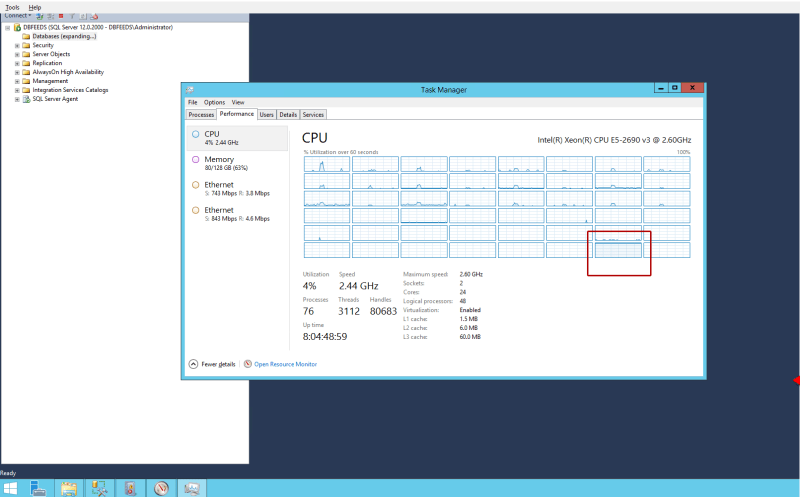
2.6GHz Intel Xeon-Haswell (E5-2690-V3-DodecaCore)
2.6GHz Intel Xeon-Haswell (E5-2690-V3-DodecaCore)
The Issue that we have:
Around the same time each day for the past 4 days 1 hour up and down the SQL Server becomes completely unresponsive, we are not able to connect to it at all, we can RDP into the machine and watch what's happening but we can not connect to the SQL Server, since it happened 4 times the first two times it lasted for 20 minutes the third time it was 10 and today it was 30 minutes. RAM starts to drop at that point and after it drops to 0 everything is back to normal.
What's interesting
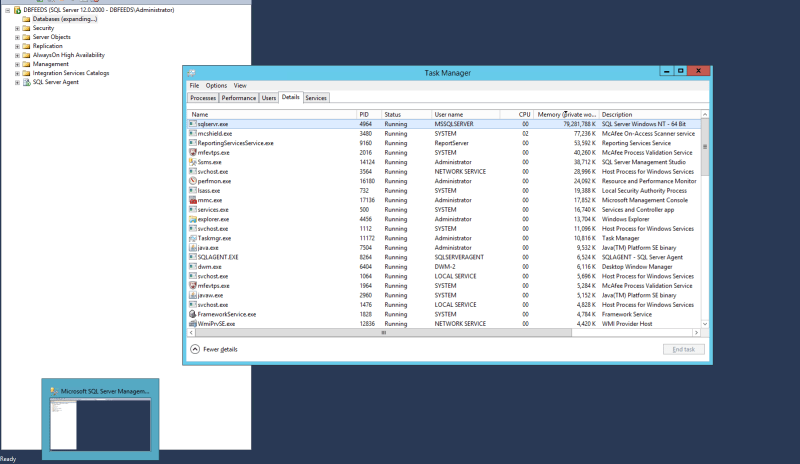
The RAM almost always get's to almost 80GB which you can see in the attached Usage.png screenshot and one of the cores is at 100% utilization when this happens. Then as time starts to pass from when it happens the RAM starts to drop little by little for the sqlserver.exe and then it drops down to 0 and, the process that was at 100% starts to work again normally and everything goes back to normal and server starts working again without any issues.
Insight into when this started happening
5 Days ago we moved onto a more powerful server which has the same exact specs as this server. Then we had this happen for two days in a row, the second time it happened and we could not figure out what's going on we moved onto a brand new server yet again thinking something is wrong with the server. The same thing is happening on a brand new server and we have absolutely no idea why. The primary difference between the old server and these new ones is that this server has more RAM and has more cores. The old server we had was a 64GB and 16 cores machine & ran the same versions of windows and MSSQL.
Windows 2012 R2 Standard 64 Bit
8x16GB Micron 16GB DDR4 2Rx4 (128 GB of RAM)
2.6GHz Intel Xeon-Haswell (E5-2690-V3-DodecaCore)
2.6GHz Intel Xeon-Haswell (E5-2690-V3-DodecaCore)
The Issue that we have:
Around the same time each day for the past 4 days 1 hour up and down the SQL Server becomes completely unresponsive, we are not able to connect to it at all, we can RDP into the machine and watch what's happening but we can not connect to the SQL Server, since it happened 4 times the first two times it lasted for 20 minutes the third time it was 10 and today it was 30 minutes. RAM starts to drop at that point and after it drops to 0 everything is back to normal.
What's interesting
The RAM almost always get's to almost 80GB which you can see in the attached Usage.png screenshot and one of the cores is at 100% utilization when this happens. Then as time starts to pass from when it happens the RAM starts to drop little by little for the sqlserver.exe and then it drops down to 0 and, the process that was at 100% starts to work again normally and everything goes back to normal and server starts working again without any issues.
Insight into when this started happening
5 Days ago we moved onto a more powerful server which has the same exact specs as this server. Then we had this happen for two days in a row, the second time it happened and we could not figure out what's going on we moved onto a brand new server yet again thinking something is wrong with the server. The same thing is happening on a brand new server and we have absolutely no idea why. The primary difference between the old server and these new ones is that this server has more RAM and has more cores. The old server we had was a 64GB and 16 cores machine & ran the same versions of windows and MSSQL.