Tek-Tips is the largest IT community on the Internet today!

Members share and learn making Tek-Tips Forums the best source of peer-reviewed technical information on the Internet!

  • Congratulations SkipVought on being selected by the Tek-Tips community for having the most helpful posts in the forums last week. Way to Go!

Help taking horizontal data and displaying it vertically (continuously)

Status
Not open for further replies.

MikeRei

MIS
Nov 29, 2023
9
0
0
US
Hello,

I am writing, because I have an issue that I just cannot overcome, and this site seems like the place to go with MS Access/VBA questions.

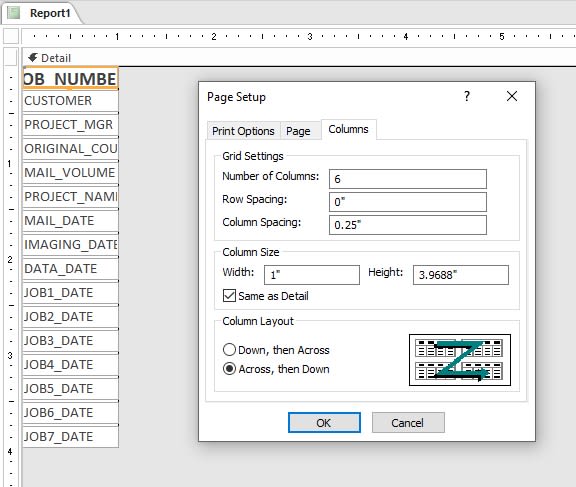
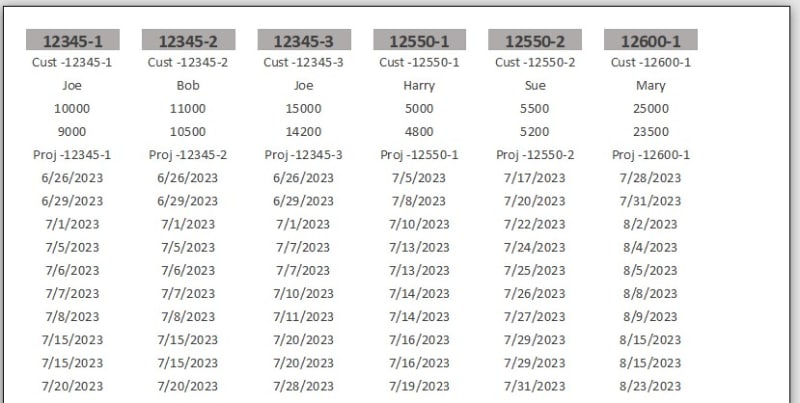
I have a table that has roughly 20 different date fields attached to records by their JOB_ID number. It is all in a single table, and I have no issue building a report that outputs a single records in the format that I would like to use. The issue is display the data in a continuous manner vertically. Each JOB_ID should have it's own column, and all dates listed below from top-to-bottom.

I have not been successful trying to get the layout right, so I was hoping someone on here could give me a hand.

Please let me know if more information is needed.

Thank you!
 
A representative example of your table would be helpful along with how the report should look mapping the data in the table to your report.

Skip,
[sub]
[glasses]Just traded in my OLD subtlety...
for a NUance![tongue][/sub]
"The most incomprehensible thing about the universe is that it is comprehensible" A. Einstein

You Matter...
unless you multiply yourself by the speed of light squared, then...
You Energy!
 
It would help if you provided some actual field names. You can create a union query like:

SQL:
SELECT JOB_ID, DateA As theDate, "A" As DateType
FROM YourTable
UNION ALL
SELECT JOB_ID, DateB, "B"
FROM YourTable
UNION ALL
SELECT JOB_ID, DateC, "C"
FROM YourTable;

Duane
Minnesota
Hook'D on Access
MS Access MVP 2001-2016
 
Sorry everyone. Some representative data is below:

I need to take a table similar to this-

ID JOB_ID DROP_NUMBER RECORD_COUNT START_DATE1 END_DATE1 START_DATE2 END_DATE2 START_DATE3 END_DATE3 START_DATE4 END_DATE4 MAIL_VOLUME
1 12345 001 10000 7/1/2023 7/5/2023 7/6/2023 7/7/2023 7/8/2023 7/15/2023 7/15/2023 7/20/2023 9000
2 12345 002 11000 7/1/2023 7/5/2023 7/6/2023 7/7/2023 7/8/2023 7/15/2023 7/15/2023 7/20/2023 10500
3 12345 003 15000 7/1/2023 7/7/2023 7/7/2023 7/10/2023 7/11/2023 7/20/2023 7/20/2023 7/28/2023 14200
4 12550 001 5000 7/10/2023 7/13/2023 7/13/2023 7/14/2023 7/14/2023 7/16/2023 7/16/2023 7/19/2023 4800
5 12550 002 5500 7/22/2023 7/24/2023 7/25/2023 7/26/2023 7/27/2023 7/29/2023 7/29/2023 7/31/2023 5200
6 12600 001 25000 8/2/2023 8/4/2023 8/5/2023 8/8/2023 8/9/2023 8/15/2023 8/15/2023 8/23/2023 23500

(I do not know why the data shifted from the headings, but I am hoping you guys can make it out)

And have it output vertically so that the JOB_ID is at the top of the column, followed by the DROP_NUMBER, RECORD_COUNT, START_DATE1, END_DATE1, etc. This data will be selected based on the month and year that the START_DATE1 value falls into. The user will be prompted for the month and year, and the data selection should output the data vertically. The columns for this report will not be consistently the same from month-to-month. Some months there may be only a single entry, and other months there may be 20.
 
Use the Pre tag from the format icons above. Then use the same tag and data with the desired output.

Duane
Minnesota
Hook'D on Access
MS Access MVP 2001-2016
 
[pre]
ID JOB_ID DROP_NUMBER RECORD_COUNT START_DATE1 END_DATE1 START_DATE2 END_DATE2 START_DATE3 END_DATE3 START_DATE4 END_DATE4 MAIL_VOLUME
1 12345 001 10000 7/1/2023 7/5/2023 7/6/2023 7/7/2023 7/8/2023 7/15/2023 7/15/2023 7/20/2023 9000
2 12345 002 11000 7/1/2023 7/5/2023 7/6/2023 7/7/2023 7/8/2023 7/15/2023 7/15/2023 7/20/2023 10500
3 12345 003 15000 7/1/2023 7/7/2023 7/7/2023 7/10/2023 7/11/2023 7/20/2023 7/20/2023 7/28/2023 14200
4 12550 001 5000 7/10/2023 7/13/2023 7/13/2023 7/14/2023 7/14/2023 7/16/2023 7/16/2023 7/19/2023 4800
5 12550 002 5500 7/22/2023 7/24/2023 7/25/2023 7/26/2023 7/27/2023 7/29/2023 7/29/2023 7/31/2023 5200
6 12600 001 25000 8/2/2023 8/4/2023 8/5/2023 8/8/2023 8/9/2023 8/15/2023 8/15/2023 8/23/2023 23500
[/pre]
So. based on this data - how the output should look like if user selects: Month 7 and Year 2023 [ponder]

---- Andy

"Hmm...they have the internet on computers now"--Homer Simpson
 
Is this what you are hoping to display?

[pre]
Row TheLabel 12345-1 12345-2 12345-3 12550-1 12550-2 12600-1
1 JOB_ID 12345 12345 12345 12550 12550 12600
2 DROP_NUMBER 1 2 3 1 2 1
3 RECORD_COUNT 10000 11000 15000 5000 5500 25000
4 START_DATE1 7/1/2023 7/1/2023 7/1/2023 7/10/2023 7/22/2023 8/2/2023
5 END_DATE1 7/5/2023 7/5/2023 7/7/2023 7/13/2023 7/24/2023 8/4/2023
6 START_DATE2 7/6/2023 7/6/2023 7/7/2023 7/13/2023 7/25/2023 8/5/2023
7 END_DATE2 7/7/2023 7/7/2023 7/10/2023 7/14/2023 7/26/2023 8/8/2023
8 START_DATE3 7/8/2023 7/8/2023 7/11/2023 7/14/2023 7/27/2023 8/9/2023
9 END_DATE3 7/15/2023 7/15/2023 7/20/2023 7/16/2023 7/29/2023 8/15/2023
10 START_DATE4 7/15/2023 7/15/2023 7/20/2023 7/16/2023 7/29/2023 8/15/2023
11 END_DATE4 7/20/2023 7/20/2023 7/28/2023 7/19/2023 7/31/2023 8/23/2023[/pre]

Duane
Minnesota
Hook'D on Access
MS Access MVP 2001-2016
 
dhookom, yes! That is the output that I need. I then want to format it on a report. How did you get to that outcome?

I apologize if I was not being specific enough. I don't really post to these kind of boards often.

I appreciate all of the help I can get!
 
The row count in my source data could go anywhere from one record to 50 records, so I need to make sure it can grow as needed from left-to-right.
 
This requires a couple queries. The first is a union query to normalize the data. Typically the dates in your data would be stored in a separate, related table with each date creating a new record.

First create the union query quniJobs which must be written in SQL view:

Code:
SELECT ID, 1 As Row, JOB_ID & "-" & DROP_NUMBER As Col,  "JOB_ID" AS TheLabel, JOB_ID AS TheValue
FROM tblMike
UNION ALL
SELECT ID, 2, JOB_ID & "-" & DROP_NUMBER, "DROP_NUMBER", DROP_NUMBER
FROM tblMike
UNION ALL
SELECT ID,3,  JOB_ID & "-" & DROP_NUMBER,"RECORD_COUNT", RECORD_COUNT
FROM tblMike
UNION ALL
SELECT ID, 4, JOB_ID & "-" & DROP_NUMBER, "START_DATE1", START_DATE1
FROM tblMike
UNION ALL
SELECT ID, 5, JOB_ID & "-" & DROP_NUMBER, "END_DATE1", END_DATE1
FROM tblMike
UNION ALL
SELECT ID, 6,  JOB_ID & "-" & DROP_NUMBER,"START_DATE2", START_DATE2
FROM tblMike
UNION ALL
SELECT ID, 7, JOB_ID & "-" & DROP_NUMBER, "END_DATE2", END_DATE2
FROM tblMike
UNION ALL
SELECT ID,8,  JOB_ID & "-" & DROP_NUMBER, "START_DATE3", START_DATE3
FROM tblMike
UNION ALL
SELECT ID, 9, JOB_ID & "-" & DROP_NUMBER, "END_DATE3", END_DATE3
FROM tblMike
UNION ALL
SELECT ID,10, JOB_ID & "-" & DROP_NUMBER, "START_DATE4", START_DATE4
FROM tblMike
UNION ALL 
SELECT ID,11, JOB_ID & "-" & DROP_NUMBER, "END_DATE4", END_DATE4
FROM tblMike;

Then create a crosstab query qxtbJobs based on the union query:

Code:
TRANSFORM First(quniJobs.TheValue) AS FirstOfTheValue
SELECT quniJobs.Row, quniJobs.TheLabel
FROM quniJobs
GROUP BY quniJobs.Row, quniJobs.TheLabel
PIVOT quniJobs.Col;

Creating a report from this will be challenging since I expect the JOB_IDs will change over time. I have an example of creating a report from a dynamic crosstab on a friend's web site.


Duane
Minnesota
Hook'D on Access
MS Access MVP 2001-2016
 
Me:
user selects: Month 7 and Year 2023
Duane: shows the output
MikeRei:
That is the output that I need

Are you OK with the last column? It is NOT for Month 7 and Year 2023

---- Andy

"Hmm...they have the internet on computers now"--Homer Simpson
 
Andrzejek, you are correct, the last row in my source data is for the month of August. I would need that row to be excluded if the user selected July of 2023 (month 7 and year 2023). One of the other issues I am having is selecting the correct recordset for a monthly output.

I am currently parsing out the month, day and year values from a field called MAIL_DATE in my source data, and then I have a form that allows the user to select the month number and year value (in separate fields). I then query on the two values that I parsed out from the MAIL_DATE that the user selected (USER_MONTH and USER_YEAR) to select the JOB_IDs that I want output in my report.

Is there any easier way around this when the MAIL_DATE field contains date values? I want the user to be able to select an entire month for the year versus typing in a beginning and end date.

You guys are the greatest!
 
Since you are going after the data in START_DATE1, why not just allow user to select from that field?

cboYears - Select Distinct Year(START_DATE1) From MyTable Order By 1
After Year is selected:
cboMonths - Select Distinct Month(START_DATE1) From MyTable Where Year(START_DATE1) = cboYears.Value Order By 1

---- Andy

"Hmm...they have the internet on computers now"--Homer Simpson
 
I’m confused where MAIL_DATE comes from since it sounded like you were filtering on START_DATE1.

I would use a combo box to row source of:

SELECT Format(START_DATE1,"YYYY-MM") As ym
FROM YourTableName
GROUP BY Format(START_DATE1,"YYYY-MM")

Then you could use the same expression to filter your query.

Duane
Minnesota
Hook'D on Access
MS Access MVP 2001-2016
 
Wouldn't that be simply:
[tt]SELECT DISTINCT Format(START_DATE1,"YYYY-MM") As ym
FROM YourTableName
Order By 1[/tt]
:)

---- Andy

"Hmm...they have the internet on computers now"--Homer Simpson
 
Andy, same result for the row source.

Mike, if you use a parameter in queries that feed a crosstab, you must set the data type of the parameter.

Duane
Minnesota
Hook'D on Access
MS Access MVP 2001-2016
 
OK, so after a little work on my end, I found a way to get what I needed for monthly selection, and I now have all of my data that I want included in the report stored into a single table. Here is where I am now:

[TestTable] contains the following fields;

JOB_NUMBER(combination of JOB_ID and DROP_NUMBER (formatted as [JOB_ID] & "-" & [DROP_NUMBER]))
CUSTOMER
PROJECT_MGR
ORIGINAL_COUNT
MAIL_VOLUME
PROJECT_NAME
MAIL_DATE
IMAGING_DATE
DATA_DATE
JOB1_DATE
JOB2_DATE
JOB3_DATE
JOB4_DATE
JOB5_DATE
JOB6_DATE
JOB7_DATE

I am going to attempt the dual-query approach laid out by dhookom above, and will be back once I have some time to do some testing.

Thank you, again!

 
You can also consider a multiple column report which might be much simpler. There is no code or extra queries. You would need to see how this is all handled with more jobs.

Design View
RptMultiColumnDesign_hv6eom.jpg


Print Preview
RptMultiColumnPreview_gpxwbj.jpg


Duane
Minnesota
Hook'D on Access
MS Access MVP 2001-2016
 
I like the idea of the multi-column report, but my issue is dealing with the column count change each time. I would like a canned report that can be ran by the user for each month, but some months there will be 2 entries, and some months there will be 20. How can I get around that with the report?

I have the output that I want from the qxtbjobs query, so now I am trying to figure out if I should export it to Excel, or just have a report that can be ran and shared.

Thank you!
 
Status
Not open for further replies.

Part and Inventory Search

Sponsor

Back
Top