hoagieryder
MIS
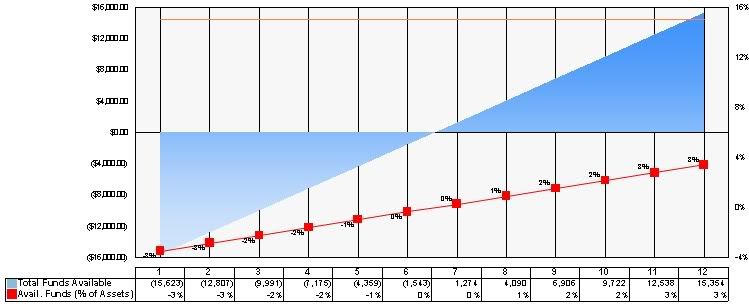
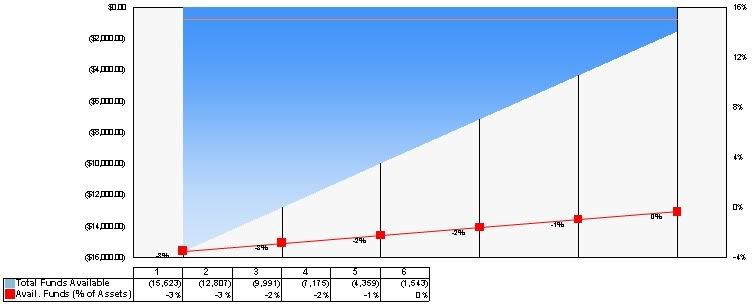
I have a bar graph that's x axis is dynamic. There could be anywhere from 2 to 12 periods. I wanted to have a data table below it that lines up with each bar that shows the data that is driving the graph. For the time being I used a cross-tab but it does not line up when I am using anything less then 12 periods. What are my options?
12 Periods
6 Periods
12 Periods
6 Periods