Tek-Tips is the largest IT community on the Internet today!

Members share and learn making Tek-Tips Forums the best source of peer-reviewed technical information on the Internet!

  • Congratulations SkipVought on being selected by the Tek-Tips community for having the most helpful posts in the forums last week. Way to Go!

Excel - Sumproduct Group by Month with multiple conditions 1

Status
Not open for further replies.

BxWill

MIS
Mar 30, 2009
367
0
16
US
[URL unfurl="true"]https://res.cloudinary.com/engineering-com/raw/upload/v1566692107/tips/Tek_Tips_20190824_Sumproduct_tnpwsl.docx[/url]


Have an MS Excel 2016 file with the following data.

[PRE]
Equip Code Sale Date Sale Price
12345 1/25/2019 8000
12346 1/26/2019 10000
89023 1/18/2019 24569
88456 2/25/2019 25000
88457 2/1/2019 13000
11567 1/12/2019 24000
11567 2/13/2019 53000
24680 1/10/2019 21000
24680 2/9/2019 14000
24699 1/5/2019 45257
12345 2/19/2019 61000
12346 1/5/2019 117500
89023 2/27/2019 25600
88456 2/20/2019 10222
88457 1/5/2019 30000
11567 1/3/2019 125000
[/PRE]


[PRE]
Sale Price
0 - < 25K 25K - < 50K 50K+
"Unique
Equip Code" 1/1/2019 2/1/2019 1/1/2019 2/1/2019 1/1/2019 2/1/2019
12345 =SUMPRODUCT(--($C$5:$C$20>0),--($C$5:$C$20<25000),--(YEAR($B$5:$B$20)=2019),--(MONTH($B$5:$B$20)=1))
12346 5
89023 5
88456 5
88457 5
11567 5
24680 5
24699 5
12345 5

[/PRE]


Using sumproduct formula to count the number of equipment by the month of the Sale Date and Sale Price for the respective equipment code.

Column A contains Equipment Code, Column B contains the Sale Date and Column C contain the Sale Price.

At Column E, I have a column that has a unique list of equipment codes. Inserting the sumproduct beginning at column F.


So far, the sumproduct formula below appears to correctly count the number of equipment that has a sale price > 0 and less than $25,000 with a sale date in 2019 and during the month of January.

Code:
Original version of sumproduct without restriction on Equipment Code

=SUMPRODUCT(--($C$5:$C$20>0),--($C$5:$C$20<25000),--(YEAR($B$5:$B$20)=2019),--(MONTH($B$5:$B$20)=1))

However, I would like to include an additional filter on the equipment code.

Code:
Have tried a revised version of the sumproduct formula as displayed below, but receive zeroes.

=SUMPRODUCT(--($C$5:$C$20>0),--($C$5:$C$20<25000),--(YEAR($B$5:$B$20)=2019),--(MONTH($B$5:$B$20)=1), --($A$5:$A$20=$E5),)


Any insight as to how the sumproduct formula needs to be modified so that I am able to count the records by month, year, and sales price in increments of $25,000 for the respective equipment codes?

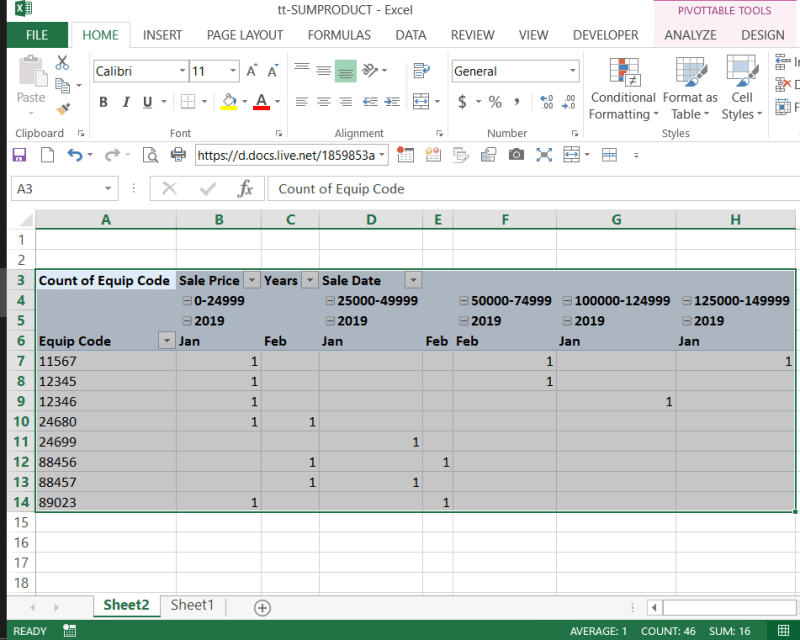
Note, I did initially attempted to perform via MS Excel pivot table but I was not able to group the data by month.

Also reviewed the use of the Aggregate function but really think that sumproduct is the preferred method to use.

Appreciate any additional insight as to if there is a more optimal method to accomplish the objective.


Hi,

I've used SUMPRODUCT() for a decade and a half, thanks to a former Tek-Tips members, Ken Wright & xlbo, to whom I owe a debt of gratitude! It is a powerful aggregation tool!

Your task is complicated by a third level of aggregation, not a third criteria. I had to put your cost spans on tow rows, as you will see. Normally I can construct ONE formula that I can COPY N PASTE through all columns and rows. But this will take TWO.

Here's the formula, having made your source data table a Structured Table named Table1.
Dates are in ROW 4:

For the January column the cost limits are in ROW 2:
[tt]
=SUMPRODUCT((Table1[Sale Price]>=F$2)*(Table1[Sale Price]<G$2)*(Table1[Sale Date]>=F$4)*(Table1[Sale Date]<G$4)*(Table1[Equip Code]=$E5))
[/tt]

For the February column the cost limits are in ROW 3:
[tt]
=SUMPRODUCT((Table1[Sale Price]>=G$3)*(Table1[Sale Price]<H$3)*(Table1[Sale Date]>=G$4)*(Table1[Sale Date]<H$4)*(Table1[Equip Code]=$E5))
[/tt]

Here is the summary table:
[pre]
Sale Price
0 25000 25000 50000 50000 999999
0 25000 25000 50000 50000 999999
EquipCD 1/1/19 2/1/19 3/1/19 1/1/19 2/1/19 3/1/19 1/1/19 2/1/19 3/1/2019

12345 1 0 0 0 0 1
12346 1 0 0 0 1 0
89023 1 0 0 1 0 0
88456 0 1 0 1 0 0
88457 0 1 1 0 0 0
11567 1 0 0 0 1 1
24680 1 1 0 0 0 0
24699 0 0 1 0 0 0
12345 1 0 0 0 0 1

[/pre]


Skip,
[sub]
[glasses]Just traded in my OLD subtlety...
for a NUance![tongue][/sub]
"The most incomprehensible thing about the universe is that it is comprehensible" A. Einstein
AD1D550E-FCB5-4AB6-A3C8-1F86CACE2554_ne1bcz.jpg
 
Interesting solution!

Currently reviewing.

The use of a structured table is noted.

One thought that I previously had was to load the text file that is received into a Sql Server Db that has a calendar table.

Then, I considered the creation of SQL scripts to display the desired result.

Also considered the use of the Aggregate function.

Considering that the text file that is received oftentimes exceed 50,000 records, any additional thought as to how you would automate the process or a different method that does not use array formulae?

Still, I am thinking that a MS Excel pivot table should be able to allow for grouping of the sales dates by month and enable the count of records by the unique equipment code.

 
thought of a PT, but in my experience, I've only used PTs for a quick N dirty solution.

In your case, here's what you get with GROUPING on Cost and Date, which is why I would stick with the SUMPRODUCT approach.
tt-sumproduct_PT_vr0ael.png


Considering that the text file that is received oftentimes exceed 50,000 records, any additional thought as to how you would automate the process or a different method that does not use array formulae?

50k rows is not a particularly large data file. Don't know how complex your actual summary might be. I've done some fairly sizable aggregations using SUMPRODUCT. Also, IMPORTing text file data should be part of your repertoire for an automated solution, that would automatically reside in a Structured Table.

Skip,
[sub]
[glasses]Just traded in my OLD subtlety...
for a NUance![tongue][/sub]
"The most incomprehensible thing about the universe is that it is comprehensible" A. Einstein
AD1D550E-FCB5-4AB6-A3C8-1F86CACE2554_ne1bcz.jpg
 
Well, I had a chance to ruminate on a query solution.

Using the Data sheet as the query data source...
Code:
Transform  Count(*)

Select
  dd.[Equip Code]
, dd.[From]
, dd.[To]

From
(
SELECT DISTINCT
  d.[Equip Code]
, d.[Sale Date]
, 0*1 as [From]
, 25000*1 as [To]

FROM [C:\Users\Skip\OneDrive\Documents\tt-SUMPRODUCT.xlsx].[Data$] d
Where d.[Equip Code] <> ''
  AND d.[Sale Price] >= 0
  AND d.[Sale Price] < 25000

UNION ALL

SELECT DISTINCT
  d.[Equip Code]
, d.[Sale Date]
, 25000*1
, 50000*1

FROM [C:\Users\Skip\OneDrive\Documents\tt-SUMPRODUCT.xlsx].[Data$] d
Where d.[Equip Code] <> ''
  AND d.[Sale Price] >= 25000
  AND d.[Sale Price] < 50000

UNION ALL

SELECT DISTINCT
  d.[Equip Code]
, d.[Sale Date]
, 50000*1
, 999999*1

FROM [C:\Users\Skip\OneDrive\Documents\tt-SUMPRODUCT.xlsx].[Data$] d
Where d.[Equip Code] <> ''
  AND d.[Sale Price] >= 50000
  AND d.[Sale Price] < 999999
) dd

Group By
  dd.[Equip Code]
, dd.[From]
, dd.[To]

Pivot Year(dd.[Sale Date]) & Format(dd.[Sale Date],'mm')

Here's the workbook with all three solutions: PT, SUMPRODUCT & Query

As you'll notice, both PT and Query share something in common: There are only values for existing data in the source data table. So it doeas not have the symetry that the SUMPRODUCT approach does.

A hybred approach might do better. So I added a Hybrid solution with a query and SUMPRODUCT.


Skip,
[sub]
[glasses]Just traded in my OLD subtlety...
for a NUance![tongue][/sub]
"The most incomprehensible thing about the universe is that it is comprehensible" A. Einstein
AD1D550E-FCB5-4AB6-A3C8-1F86CACE2554_ne1bcz.jpg
 
 https://files.engineering.com/getfile.aspx?folder=c817978c-eaf7-40f1-be32-ccb4456adaf2&file=tt-SUMPRODUCT.xlsx
Great insight Skip!

Will review the workbook in more detail.

Immediate thought is that you are using MS Query within MS Excel.


Yes, the benefits of sumproduct is noted. However, one concern is that due to the possibility of several hundred sumproduct formulae, the speed of worksheet calculation may be affected.

 
Yes, MS Query within MS Excel.

I'd be grabbing the source data from wherever external source into the Data sheet, which I now see I left with a Filter, via a Text IMPORT or a QUERY depending on the source. Either will reside in a Structured Table.

If your concern is performance, I'd opt for the Transform Query.

Had fun remembering things from 5[sup]+[/sup] years ago that I had forgotten.

Skip,
[sub]
[glasses]Just traded in my OLD subtlety...
for a NUance![tongue][/sub]
"The most incomprehensible thing about the universe is that it is comprehensible" A. Einstein
AD1D550E-FCB5-4AB6-A3C8-1F86CACE2554_ne1bcz.jpg
 
Appreciate the hybrid approach!


I eventually would like to store the results back in a Sql Server table similar to the below and
be able to readily perform analyses/comparisons across various months and/or years at any given time.

[Pre]
Equip Code Month SalesPriceLevel Nbr
12346 1/1/2019 0 - < 25K 2
89023 1/1/2019 0 - < 25K 1
88456 1/1/2019 0 - < 25K 0
88457 1/1/2019 0 - < 25K 0
11567 1/1/2019 0 - < 25K 1
24680 1/1/2019 0 - < 25K 1
24699 1/1/2019 0 - < 25K 0
12345 1/1/2019 0 - < 25K 1
12346 2/1/2019 0 - < 25K 0
89023 2/1/2019 0 - < 25K 0
88456 2/1/2019 0 - < 25K 1
88457 2/1/2019 0 - < 25K 1
11567 2/1/2019 0 - < 25K 0
24680 2/1/2019 0 - < 25K 1
24699 2/1/2019 0 - < 25K 0
12345 2/1/2019 0 - < 25K 0
[/Pre]


Any further thoughts regarding the exporting of the data back to Sql Server as a normalized table?

Maybe, I will post to the Sql Server forum as well...
 
So you want to discard your more granular source data and only save a monthly aggregation of Sales Price ranges for future analysis?

My shoot-from-the-lip response is, "Why?" Especially if you were to use queries, which can crunch huge amounts of data, why loose the source data?

That's my $0.02!

Skip,
[sub]
[glasses]Just traded in my OLD subtlety...
for a NUance![tongue][/sub]
"The most incomprehensible thing about the universe is that it is comprehensible" A. Einstein
AD1D550E-FCB5-4AB6-A3C8-1F86CACE2554_ne1bcz.jpg
 
BTW, in your thread in the SQL Server forum, you state
Receive a text file that contains data from a Sql Server database.

I import the text file into MS Excel to create a Report.

Why can't you query the database directly?

Skip,
[sub]
[glasses]Just traded in my OLD subtlety...
for a NUance![tongue][/sub]
"The most incomprehensible thing about the universe is that it is comprehensible" A. Einstein
AD1D550E-FCB5-4AB6-A3C8-1F86CACE2554_ne1bcz.jpg
 
Was thinking of maintaining the detail within the Sql Server database but also storing aggregated data within a table in the database as well for quick trend analyses, forecasting, etc.

Realize that it may be akin to storing calculated fields within a database that is considered not good database design.

Yes, data within the database is usually at the granular level and adhere to all of the concepts such as normalization, primary keys, etc.

The storing of aggregated data would still be normalized and have primary keys, etc.

If not storing the aggregated data, then it would seem that one would need to constantly query the data and aggregate for a matrix report on request - an endless cycle.

In essence, there is a hierarchy - going from the daily granular view to the next level up - a monthly view.

Really think that this is along the line of creating a cube in Sql Server to generate fast reports with optimal performance using aggregated information stored in the cube like total sales, sales per year, month, week, etc.


Yes, Querying the database directly is the next step - the one that I am currently working on.

Hence, the reason for the posting.
 
Status
Not open for further replies.

Part and Inventory Search

Sponsor

Back
Top