Hi folks, I am exporting to excel via VBScript and I am trying to figure out how to set the legend - what looks wrong with this? The code for the chart is as follows, the resulting image is attached:
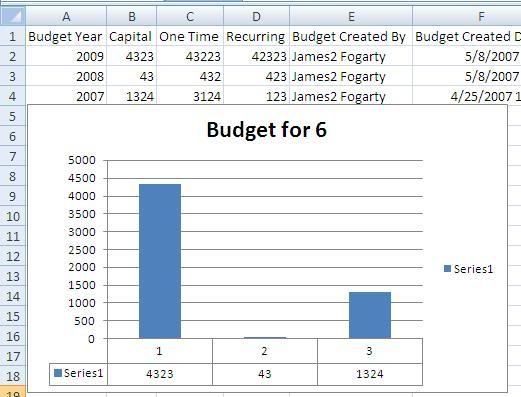
What I'd like is for the legend where is says "Series 1" to say, "Capital", or some value from a range, or cell.
Can I do this?
Thanks,
James
Code:
objWorksheet.Columns.AutoFit
Dim objRange : Set objRange = objWorksheet.Range("B2","B4")
objRange.Select
objWorkbook.Charts.Add
objWorkbook.ActiveChart.ChartType = 52
objWorkbook.ActiveChart.SetSourceData objRange, 2
objWorkbook.ActiveChart.Location 2,"Budget for 6"
objWorkbook.ActiveChart.HasTitle = True
objWorkbook.ActiveChart.chartTitle.text = "Budget for 6"
objWorkbook.activechart.HasDataTable = True
objWorkbook.activechart.DataTable.ShowLegendKey = True
What I'd like is for the legend where is says "Series 1" to say, "Capital", or some value from a range, or cell.
Can I do this?
Thanks,
James