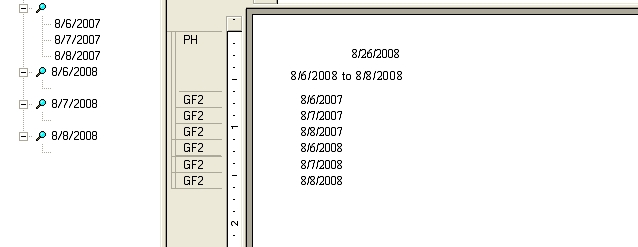
I have a report that pulls data from both a date period in the current year and the same period last year.
I would like the report to display by day with the current date range ascending on the left with last year's data on the right.
Currently, my report is

What programming magic do I have to conduct to align the respective dates and ultimately pull data from those days (order count, net sales, profit, etc).
The select statement I use to bring both periods in is
(
{V_Sales_History_w_Ecomm_Attributes.glpostdt} = {?Date Range} or
{V_Sales_History_w_Ecomm_Attributes.glpostdt} in dateserial(year(minimum({?Date Range}))-1, month(minimum({?Date Range})), day(minimum({?Date Range}))) to
dateserial(year(maximum({?Date Range}))-1, month(maximum({?Date Range})), day(maximum({?Date Range})))
)
TIA
Jason
I would like the report to display by day with the current date range ascending on the left with last year's data on the right.
Currently, my report is

What programming magic do I have to conduct to align the respective dates and ultimately pull data from those days (order count, net sales, profit, etc).
The select statement I use to bring both periods in is
(
{V_Sales_History_w_Ecomm_Attributes.glpostdt} = {?Date Range} or
{V_Sales_History_w_Ecomm_Attributes.glpostdt} in dateserial(year(minimum({?Date Range}))-1, month(minimum({?Date Range})), day(minimum({?Date Range}))) to
dateserial(year(maximum({?Date Range}))-1, month(maximum({?Date Range})), day(maximum({?Date Range})))
)
TIA
Jason
