Tek-Tips is the largest IT community on the Internet today!

Members share and learn making Tek-Tips Forums the best source of peer-reviewed technical information on the Internet!

  • Congratulations SkipVought on being selected by the Tek-Tips community for having the most helpful posts in the forums last week. Way to Go!

Build comma separated list with output from formulas 1

Status
Not open for further replies.

lm1340

Technical User
Apr 27, 2015
28
0
0
US
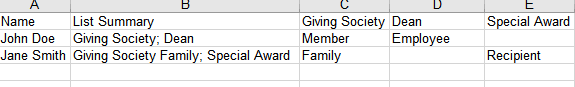
I need to build a comma-separated list with the data that is output from the formulas I've setup. There are 40 different groups (based on 40 different formulas) that people can fall into. Each person can be part of more than one group. I need to build a list summarizing the groups that they fell into. Is there a simple way to do this - generating a comma-separated list of all the groups they're in?
 
A simple solution to summarize the data would be to insert a crosstab in the report header or footer, using {table.person} for the row and {table.group} for the column. The summary could be almost anything, e.g., maximum of {table.person}, which would then show up if the person was a group member. You can remove subtotals and totals in the last crosstab tab.

If the comma-separated list is essential for some other use, you need to provide more info, e.g., sample results for two or three people with fields labeled. You should also show the contents of of a couple of your formulas, including any nested formulas. It might be helpful also to know how the resulting lists will be used.

-LB
 
Unfortunately, I can't use a cross-tab for formatting purposes. The formulas aren't complicated, but they're each set to super-specific output criteria and formatting based on the data.

Essentially, it will end up in almost a spreadsheet-like column format. The person's name would be listed in rows with columns such as "Giving Society" and "Dean" and "Special Award". Based on those columns being populated, their would be a summary field that read "Giving Society; Dean; Special Award". An example of the desired output is below (in Excel for ease of demonstration).

CR_Example_lyodly.png


Example of formula for field output:
Code:
IF {Membership_CnMem_1Cur.CnMem_1Cur_Category_description} = "Giving Society" AND (isnull({Membership_CnMem_1AtrCat.CnMem_1AtrCat_1_Description}) or {Membership_CnMem_1AtrCat.CnMem_1AtrCat_1_Description} = "Invite Only")
THEN "Member"
ELSE
    (IF {Membership_CnMem_2Cur.CnMem_2Cur_Category_description} = "Giving Society" AND (isnull({Membership_CnMem_2AtrCat_1.CnMem_2AtrCat_1_Description}) or {Membership_CnMem_2AtrCat_1.CnMem_2AtrCat_1_Description} = "Invite Only")
    THEN "Family"
    ELSE "")
 
Assuming your data now shows multiple rows for each person, but with only one entry per column (formula) per person, you could group on {table.person} and then write a formula like the following to place in the group header and then suppress the detail and group footer section. The formula below also assumes that your column formulas cannot result in nulls—if they can, you would have to add in null checks.

Maximum({@GivingSociety},{table.person})+”; ”+maximum({@Dean},table.person)+”; ” +maximum({@SpecialAward},{table.person})//etc.

Be sure to replace my single quotes with straight ones.

-LB
 
I do have it grouped by the person already and it can result in nulls. Looks like it'll be long formula for all 40 potential options. I appreciate the help!
 
You could consider changing your report setting to “convert nulls to default”, but then you would have to change your current null checks inside your formulas from null to “”. Might be the most reliable way and easiest way to go. Maybe save your report as a test version and use the convert nulls to default and see how that works for you.

-LB
 
Status
Not open for further replies.

Part and Inventory Search

Sponsor

Back
Top